Home / Projects

Projects

Capability Examples

The workflows below describe the type of engagement GISPromo delivers — the problem, the method and the outputs — so you can judge fit before the first conversation.

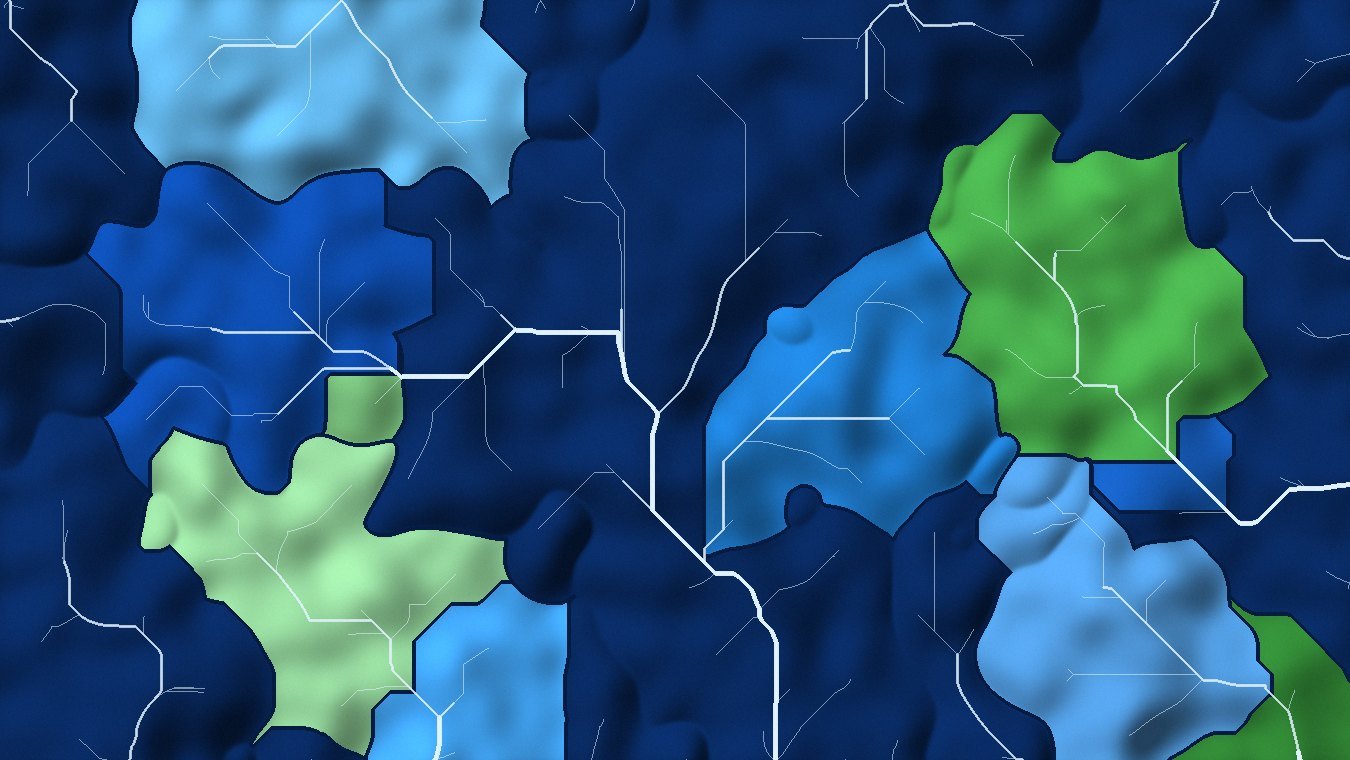
Colour-coded sub-watersheds delineated from a conditioned digital elevation model

Water Resources

Watershed delineation & sub-catchment prioritization

DEM conditioning, flow direction and accumulation modelling, stream-network extraction and sub-watershed delineation, followed by multi-criteria ranking to identify the catchments where intervention would matter most.
ArcGIS Pro / QGISDEM & hydrologyPriority map series
RUSLE soil-loss surface with erosion hotspots concentrated on steep slopes

Soil & Sediment

RUSLE soil-erosion assessment with hotspot ranking

Rainfall erosivity, soil erodibility, slope-length-steepness, cover and practice factors assembled into a raster erosion surface, then aggregated by sub-watershed and land-use class to isolate the areas driving loss.

RUSLERaster analysisHotspot & scenario maps
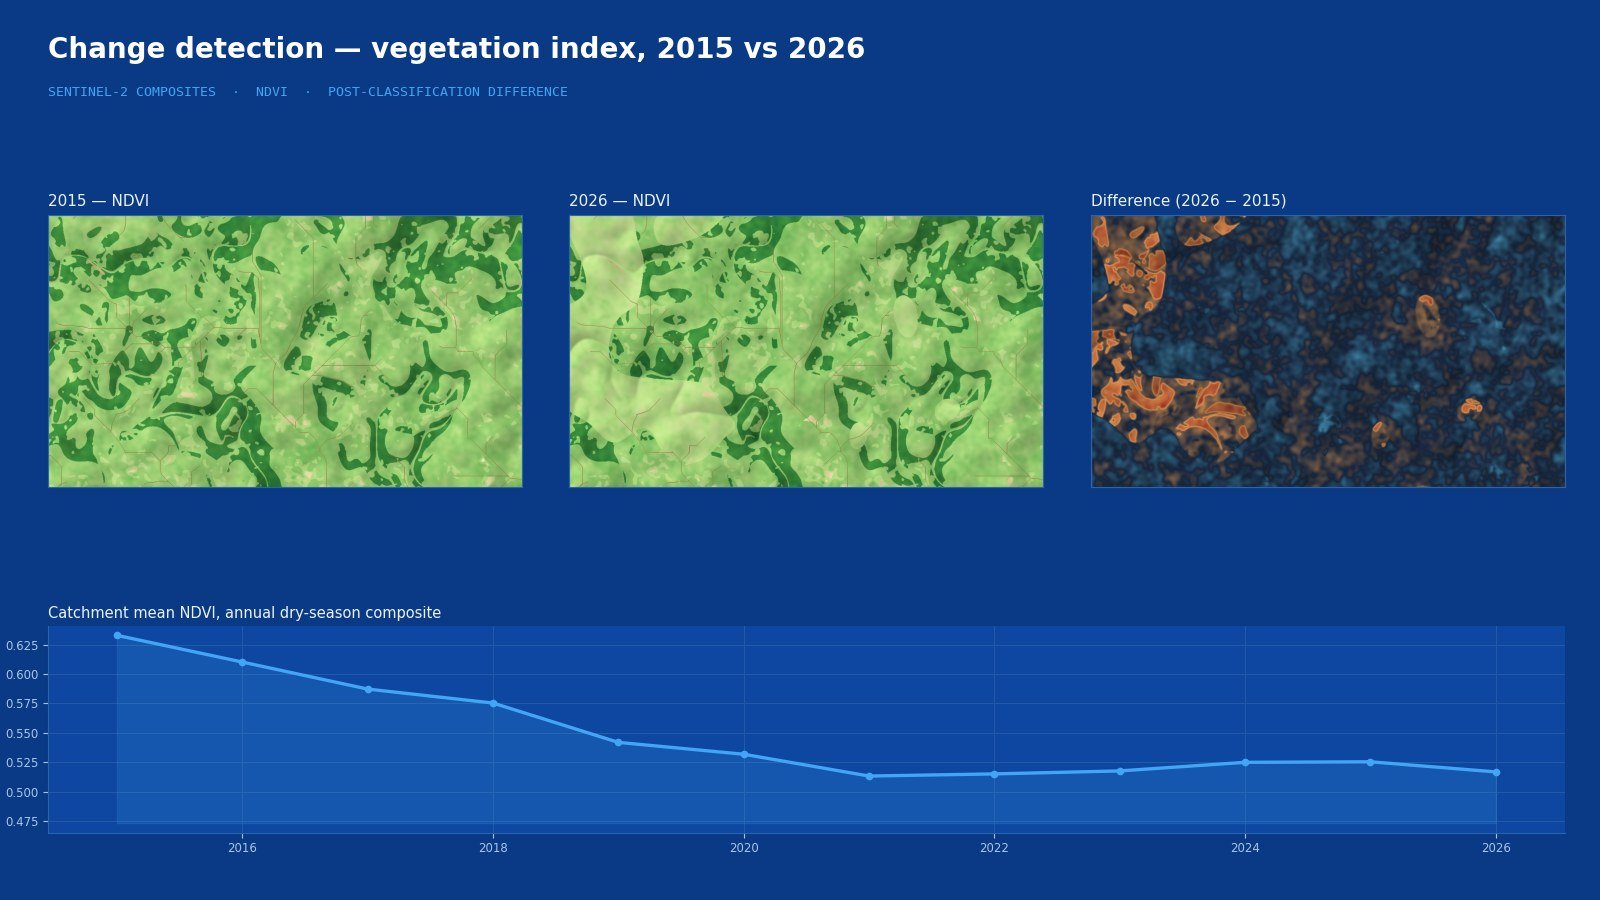
Two-date vegetation index comparison with a difference map and catchment trend

Earth Observation

Land-cover change detection & vegetation trend analysis

Multi-date satellite imagery processed into consistent land-cover classifications, with post-classification change matrices and spectral-index time series to separate real landscape change from seasonal noise.

Sentinel-2 / LandsatClassificationChange matrix & trend maps
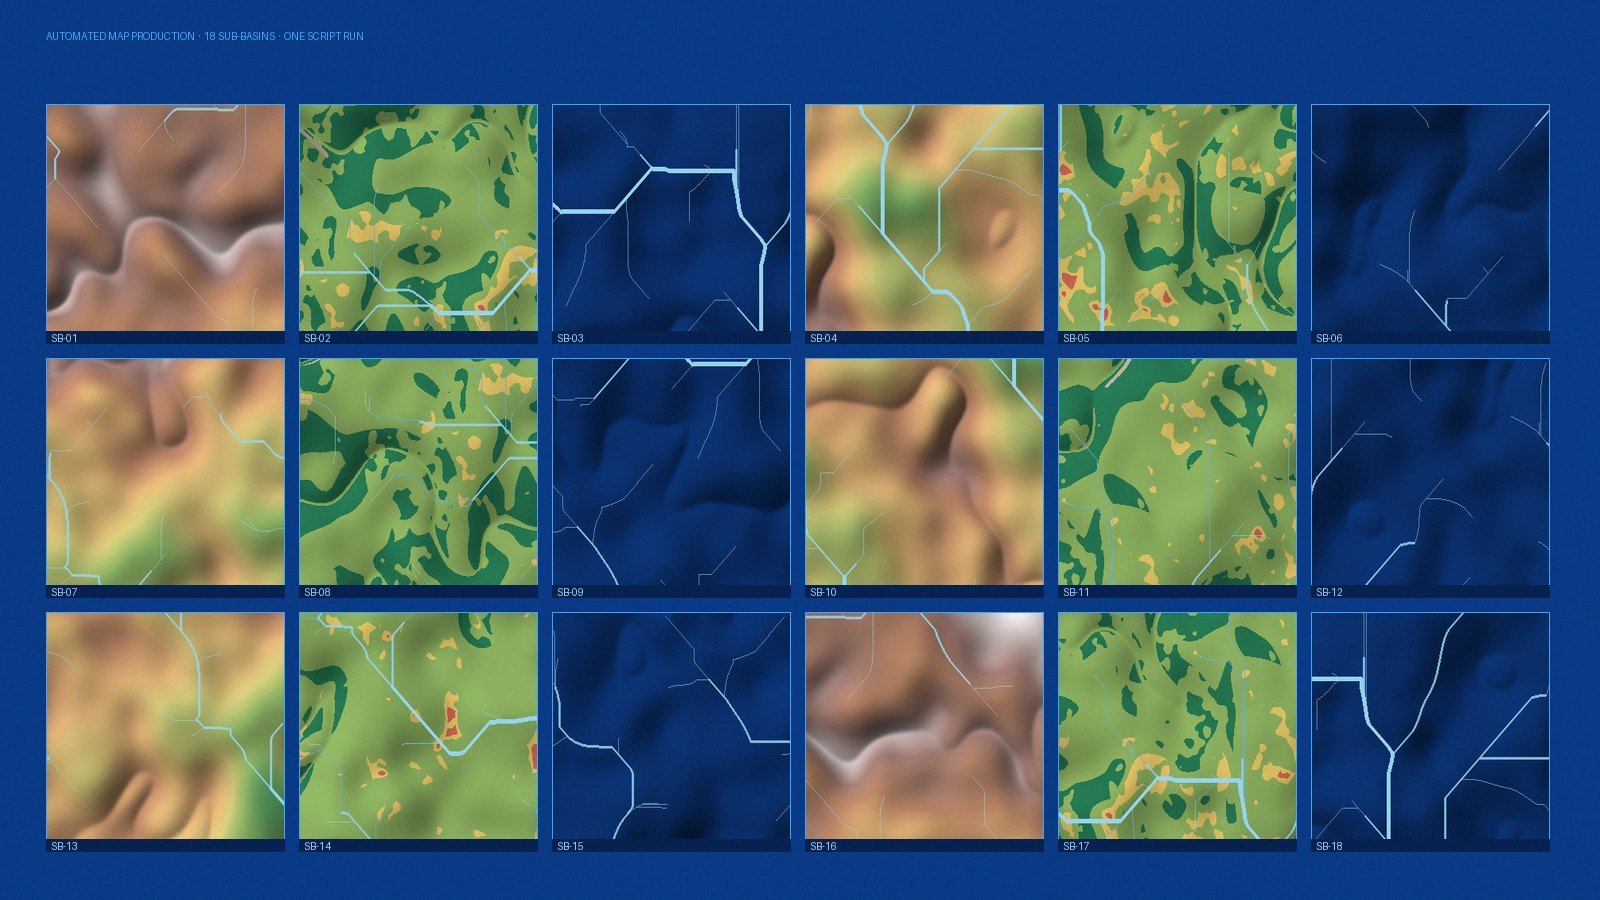
Eighteen sub-basin map sheets generated automatically in one script run

Automation

Automated batch geoprocessing & map production

A repetitive manual GIS routine rebuilt as a parameterised Python/ArcPy tool: batch clipping, reprojection, attribute derivation, QA checks and templated map export across hundreds of features in one run.

Python / ArcPyBatch processingRe-runnable tool + docs
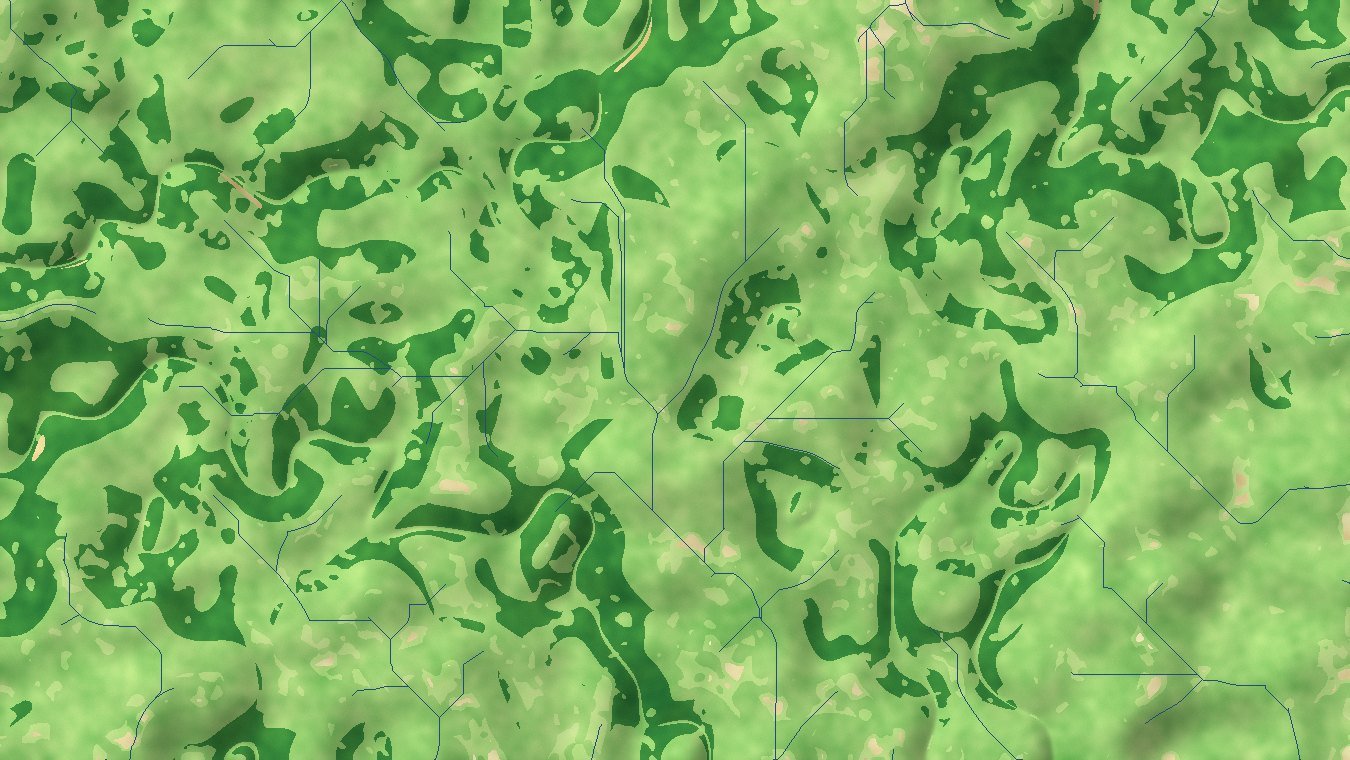
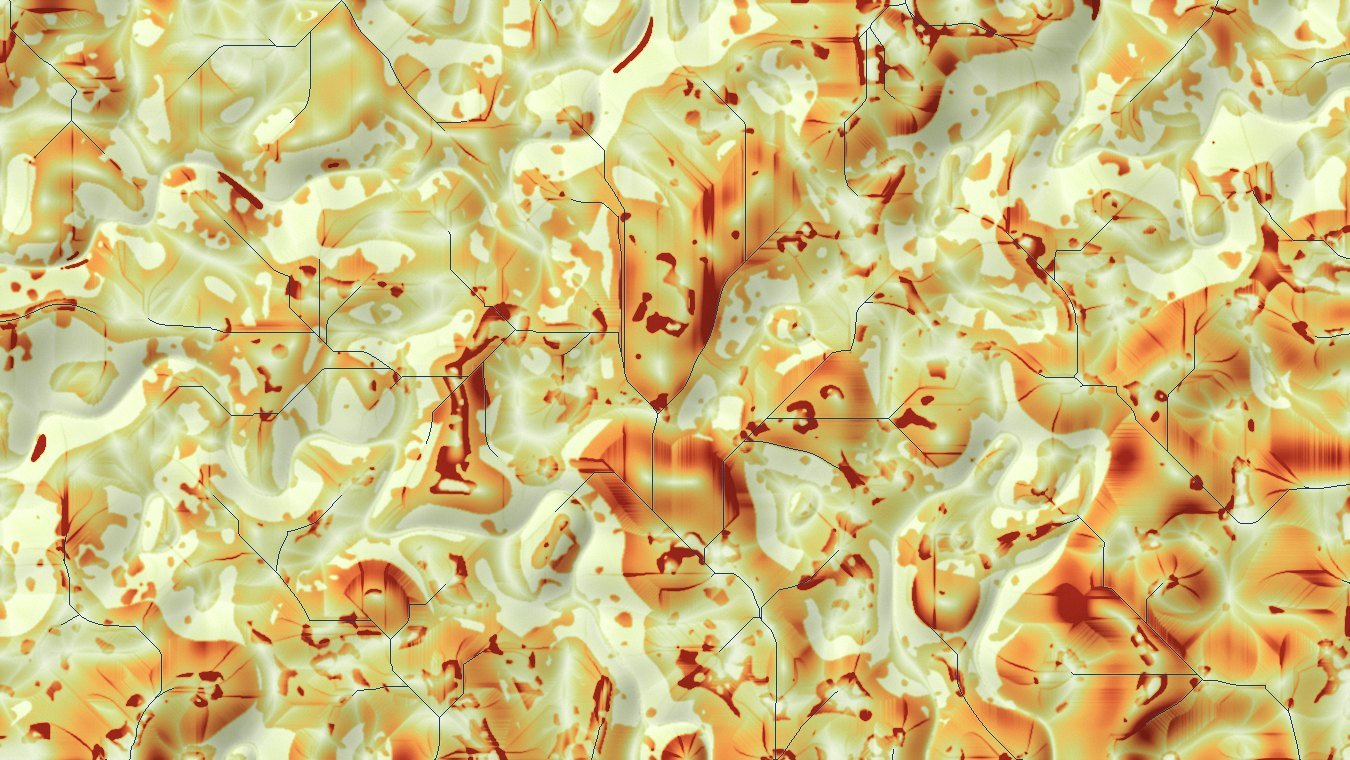
Vegetation index surface derived from a satellite composite

Monitoring

Cloud-based environmental monitoring on Earth Engine

An Earth Engine workflow that composites imagery, masks cloud, computes indices over a region of interest and exports periodic summaries — so monitoring continues without reprocessing archives by hand.

Google Earth EngineTime seriesRecurring exports
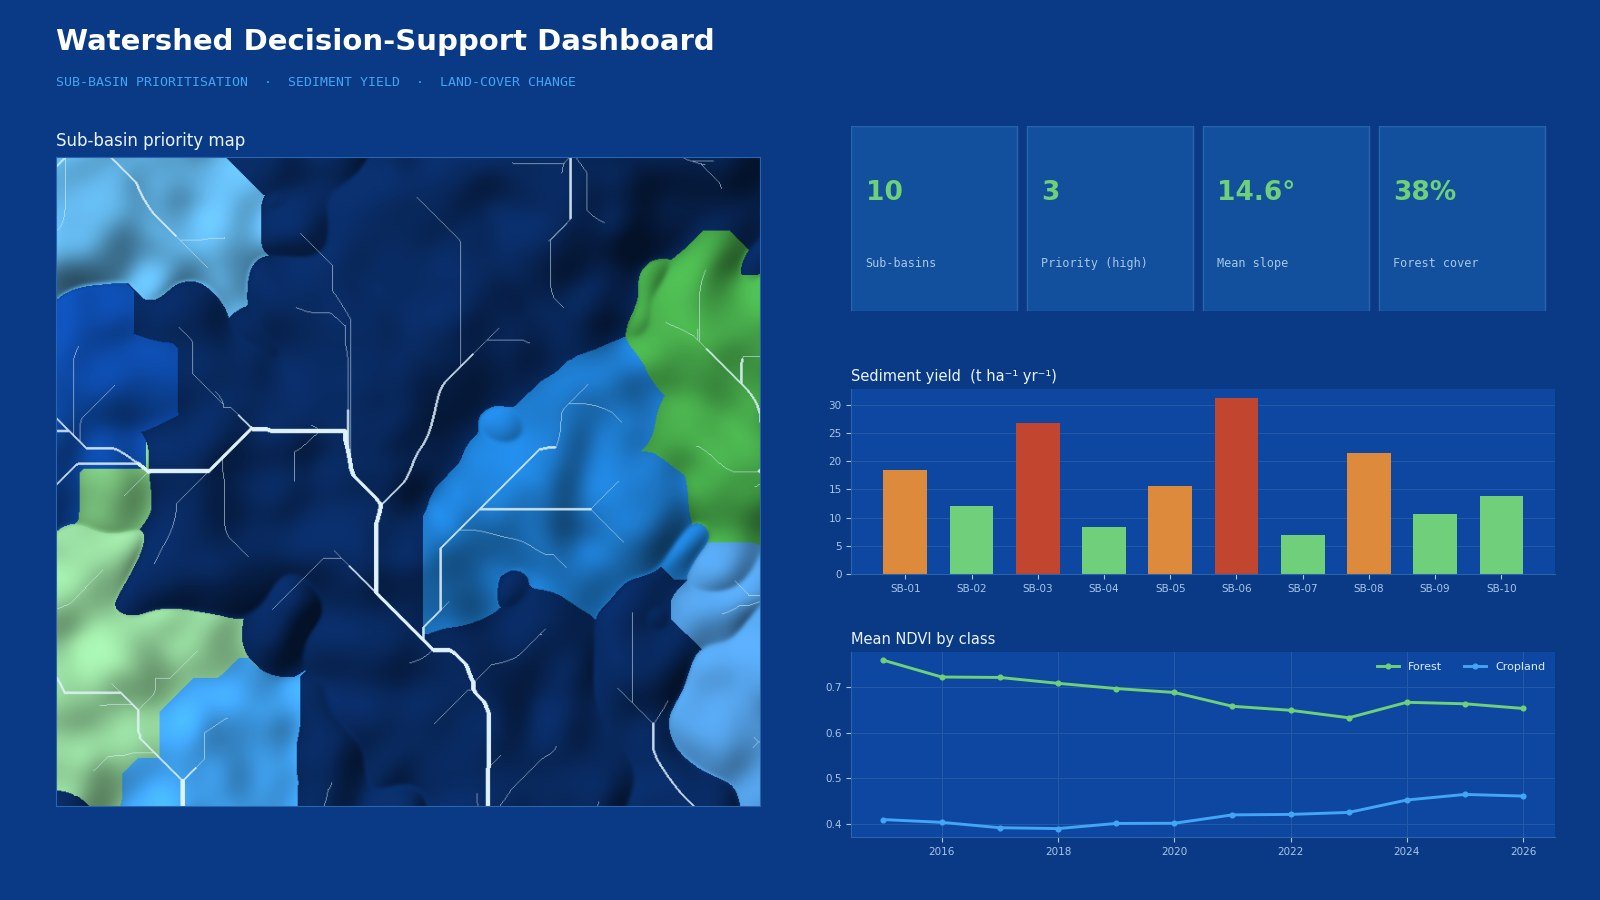
Spatial dashboard pairing a priority map with sediment-yield and NDVI charts

Web GIS

Spatial dashboard for decision support

Model and monitoring outputs published as an interactive map and indicator dashboard, so non-GIS staff can filter by area, compare scenarios and read the result without opening desktop software.

Web GIS / ArcGIS OnlineDashboardsStakeholder access
Typical Outputs

What lands on your desk

MapsPrint-ready and digital cartographic series
DataEditable, projection-consistent GIS layers
CodeDocumented, re-runnable processing scripts
ReportsMethod, assumptions, results and limits

Have a project in mind?

Send the study area, the question and whatever data you already hold. We'll respond with a proposed approach and a clear view of what it can deliver.